Cultural heritage materials, once digitized, remain largely unstructured: human-readable, but not systematically queryable, linkable, or analyzable. Large language models have improved access to such content, yet they cannot guarantee epistemic traceability. Viewsari addresses this gap by treating knowledge extraction from historical text as an interpretive activity, recording agents, prompts, software versions, and source contexts for each extracted statement.
The approach is neuro-symbolic: the Viewsari ontology (symbolic component) provides a formal schema that structures and constrains extraction tasks assigned to a large language model (neural component). Vasari's Lives (1568) serves as testbed — a founding document of art history characterized by implicit entity references, attributions presented as facts, and long-tail entities absent from standard knowledge bases.
The three questions this dissertation set out to answer. Click each one to see the short answer and where to explore it on this site.
RQ1 What representational commitments must a knowledge graph make to remain accountable to the interpretive act that produced it?
RQ2 Under what conditions can large language models recognize and link the implicit and out-of-knowledge-base (OOKB) mentions that surface form-baselines miss?
RQ3 What reusable ontology design pattern emerges from modeling extraction as a documented, provenance-aware interpretive process, and how does that foundation transfer to structurally distinct interpretive corpora?
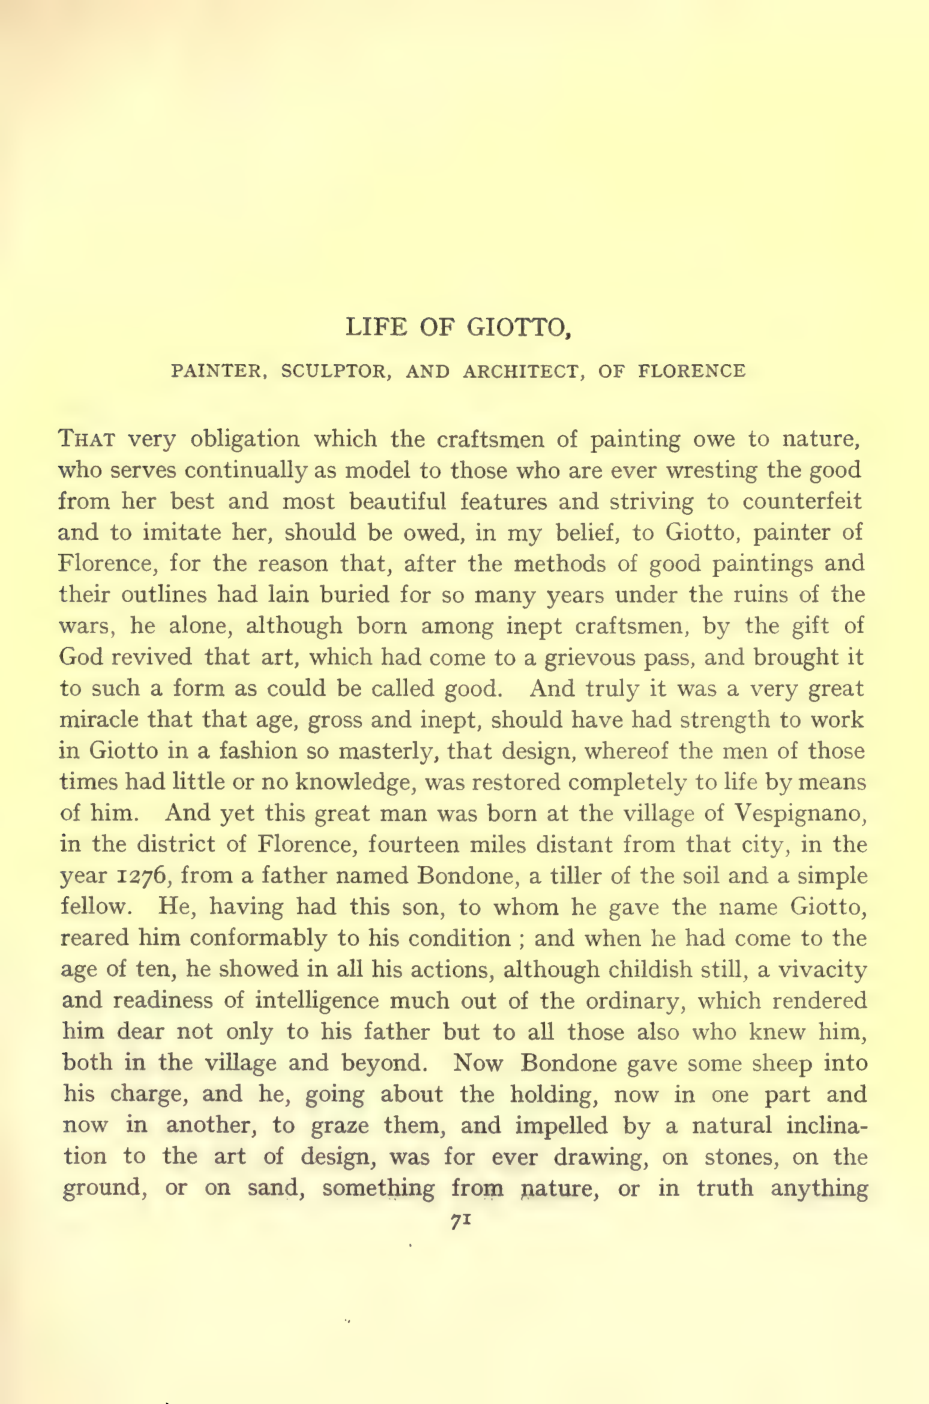 GIOTTO
Open biography →
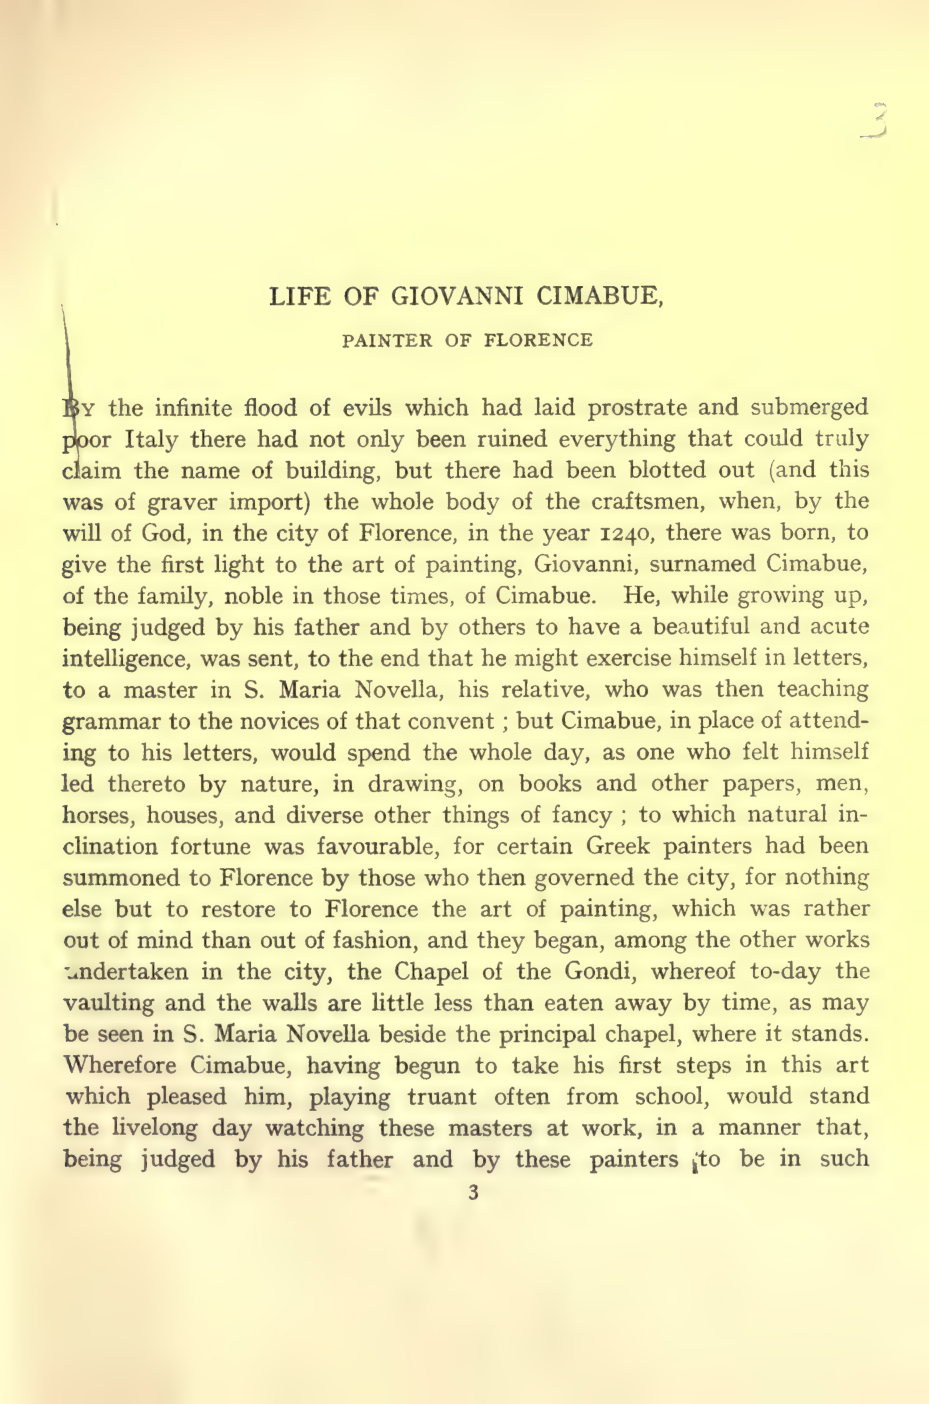
GIOVANNI CIMABUE
GIOTTO
Open biography →
GIOVANNI CIMABUE
 GIOVANNI CIMABUE
Open biography →
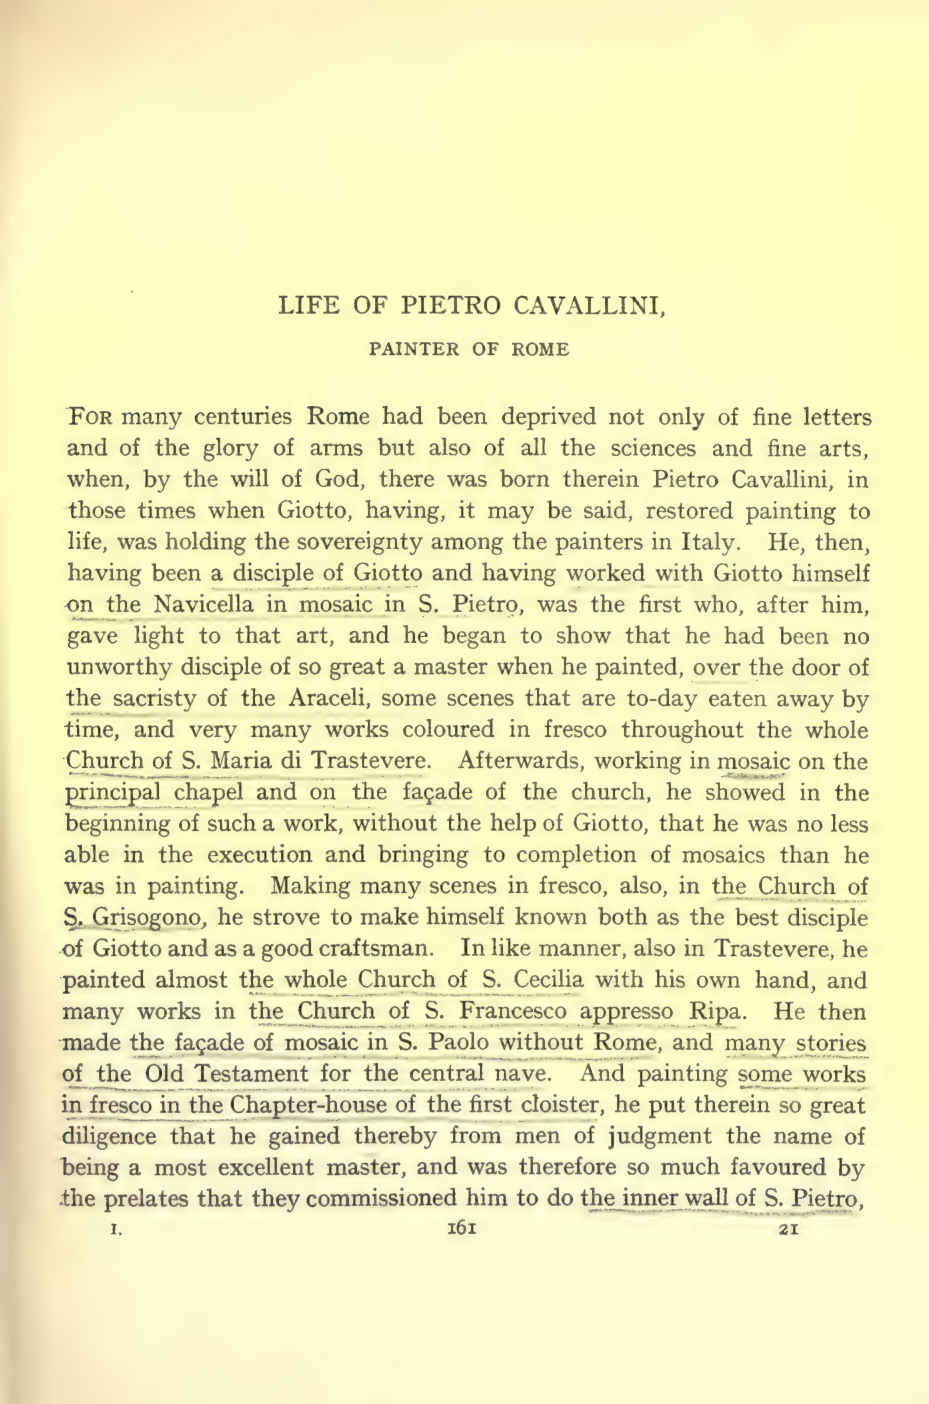
PIETRO CAVALLINI
GIOVANNI CIMABUE
Open biography →
PIETRO CAVALLINI
 PIETRO CAVALLINI
Open biography →
Vol. 2
Filippo Brunelleschi
PIETRO CAVALLINI
Open biography →
Vol. 2
Filippo Brunelleschi
 Filippo Brunelleschi
Open biography →
Vol. 3
Alesso Baldovinetti
Filippo Brunelleschi
Open biography →
Vol. 3
Alesso Baldovinetti
 Alesso Baldovinetti
Open biography →
Andrea Verrocchio
Alesso Baldovinetti
Open biography →
Andrea Verrocchio
 Andrea Verrocchio
Open biography →
Antonio and Piero Pollaiuolo
Andrea Verrocchio
Open biography →
Antonio and Piero Pollaiuolo
 Antonio and Piero Pollaiuolo
Open biography →
Cosimo Rosselli
Antonio and Piero Pollaiuolo
Open biography →
Cosimo Rosselli
 Cosimo Rosselli
Open biography →
Domenico Ghirlandajo
Cosimo Rosselli
Open biography →
Domenico Ghirlandajo
 Domenico Ghirlandajo
Open biography →
Gherardo
Domenico Ghirlandajo
Open biography →
Gherardo
 Gherardo
Open biography →
Leon Batista Alberti
Gherardo
Open biography →
Leon Batista Alberti
 Leon Batista Alberti
Open biography →
Sandro Botticelli
Leon Batista Alberti
Open biography →
Sandro Botticelli
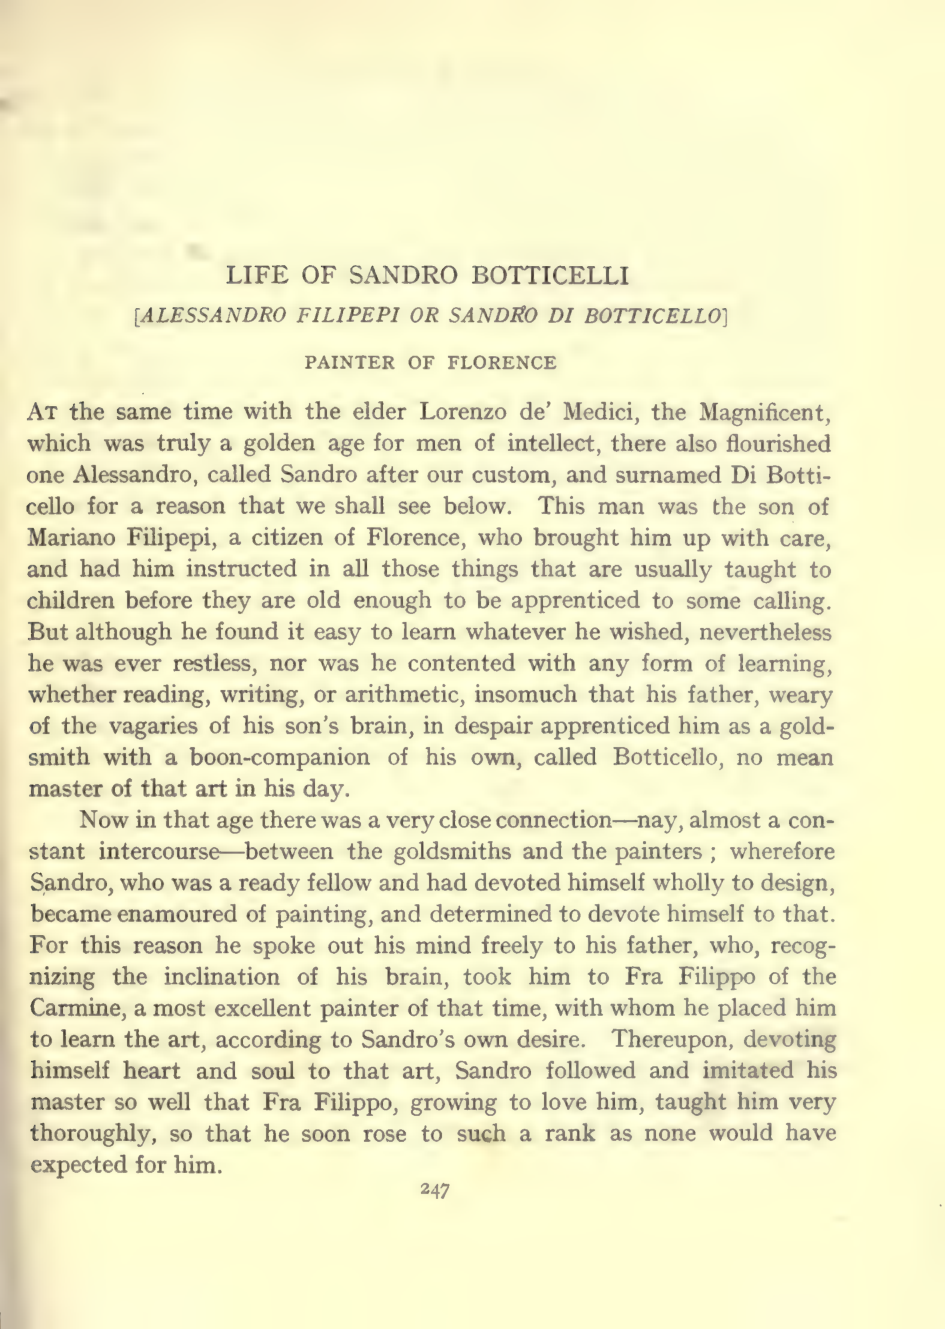 Sandro Botticelli
Open biography →
Vol. 4
Filippo Lippi, called Filippino
Sandro Botticelli
Open biography →
Vol. 4
Filippo Lippi, called Filippino
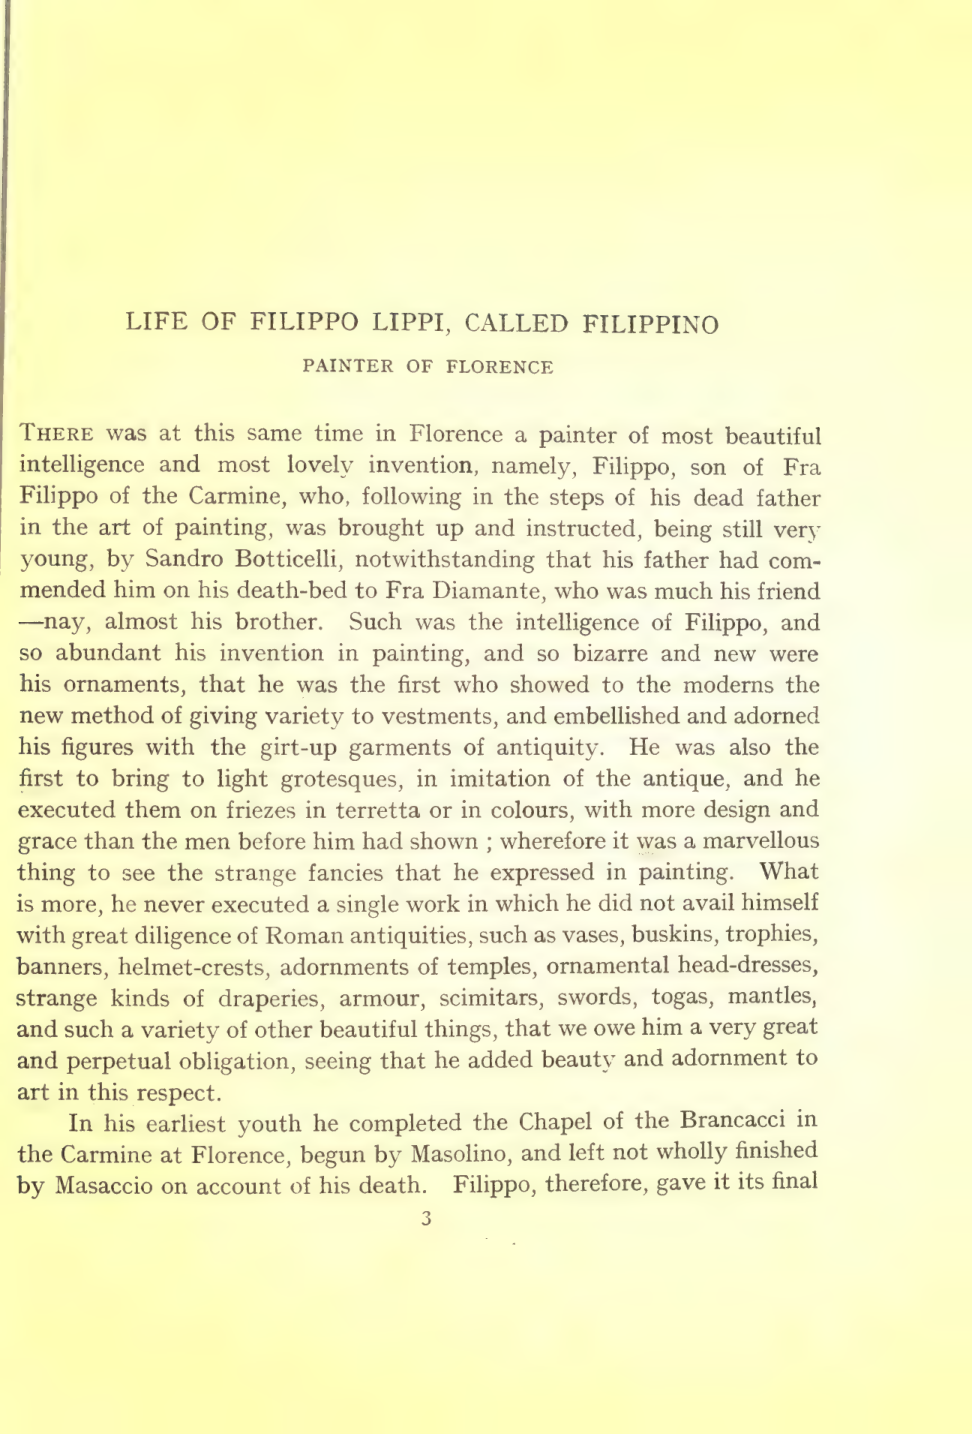 Filippo Lippi, called Filippino
Open biography →
Vol. 7
Jacopo da Pontormo
Filippo Lippi, called Filippino
Open biography →
Vol. 7
Jacopo da Pontormo
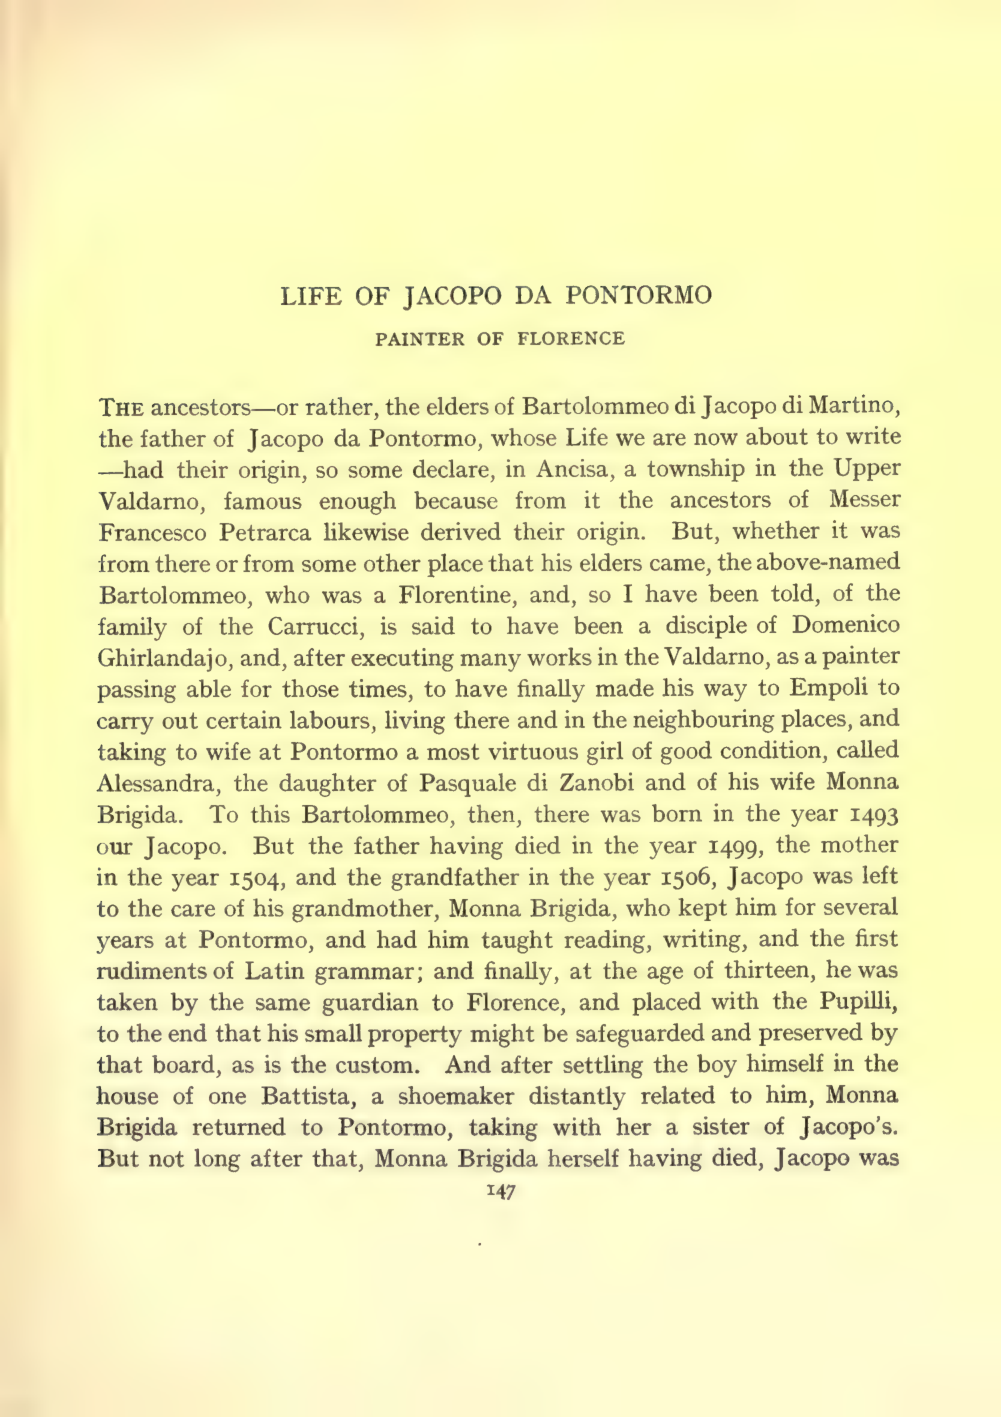 Jacopo da Pontormo
Open biography →
Vol. 9
Michelagnolo Buonarroti
Jacopo da Pontormo
Open biography →
Vol. 9
Michelagnolo Buonarroti
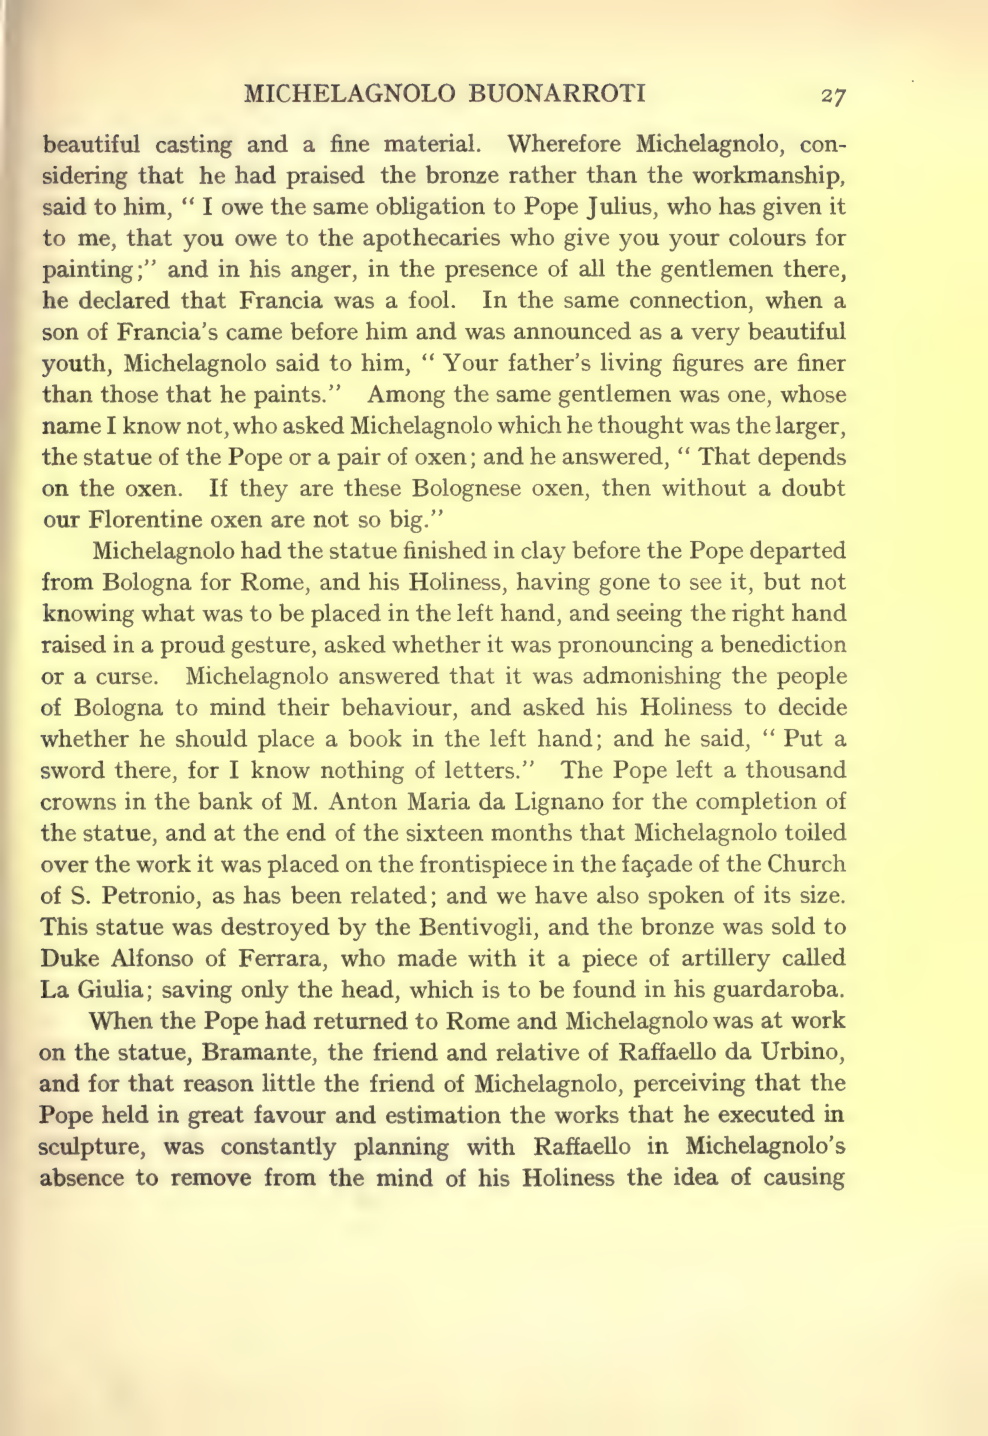 Michelagnolo Buonarroti
Open biography →
Tiziano da Cadore
Michelagnolo Buonarroti
Open biography →
Tiziano da Cadore
 Tiziano da Cadore
Open biography →
Tiziano da Cadore
Open biography →